
Introduction
Sheffield Hallam University aims to create an environment that is free from harassment, violence, hate and discrimination of any kind, with effective policies and processes, a clear system for incidents to be reported, and a range of specialist support available.
In 2018 the University's Report and Support service was launched as part of the Student Wellbeing Service, providing an online platform for students, staff and visitors to find out information about sexual misconduct, bullying, harassment, discrimination or hate, and to make a disclosure. Since 2021 our Harassment, Sexual Misconduct and Hate Crime (HSMHC) Programme has been the strategic lead on tackling issues in this area.
This is our third annual report and its purpose is to:
- Give confidence to service users and other stakeholders that we take account of the issues reported to us
- Build trust in our reporting process
- Provide insight and evaluation to assist the development of good practice
- Provide information to the HSMHC Steering Group and key contacts in order to make process and service improvements
In this report we have chosen to focus on high level institutional trends to provide a comprehensive overview, however, more detail on local data can be provided on request to a particular College or Department. The data presented covers the reporting period 1 August 2023 to 31 July 2024 and is mostly drawn from Report and Support, our main reporting platform, which includes both anonymous reports and those for which personal details were provided. Terminology in the data insights corresponds to that used on the Report and Support reporting form. Data is also presented from other reporting pathways, such as the Student Policy, Casework and Compliance team, Human Resources and Organisational Development directorate, and our training and survey platforms.
Duplicate and spam reports have been removed. To avoid possible identification of individuals where the number is 0-5, data has been presented as '5 or fewer' or categories have been grouped. Percentages quoted in the text are generally rounded up or down to aid reading. For charts where more than one option could be selected on the report form, percentages are not displayed. We refer to parties as the ‘reporting party’ or ‘reporter’, and the ‘reported party’. A downloadable version of this report is also available.
Report Headlines
- The Report and Support service received a total of 418 reports in 2023-24, slightly higher than in the previous year, although the rate of annual increase has slowed.
- 76% of people reported with their personal details rather than anonymously.
- Most reports were from students reporting on behalf of themselves and from staff reporting on behalf of students, about other students.
- The most common incident type was Bullying / Harassment, following the trend of previous years, which made up a quarter of all reports.
- The suspected motivating factor of incidents indicates that 56% were based on hate.
- 16% of student reports to Report and Support progressed to a formal complaint.
- The number of students and staff who completed training was relatively low.
- 86% of respondents to a feedback survey agreed or strongly agreed that the overall offer of support they received from the Report and Support team was helpful.
Overview of the Reporting Process
Report and Support Website
The Sheffield Hallam University Report and Support website provides information with the aim of helping the University community to understand about harassment, sexual misconduct, abuse and hate crime, and supporting people to make an informed decision on what their options are. As well as definitions and explanations around the subject area, this includes an outline of training for staff and students, and links to relevant policies and annual reports so that people have information in one place.
How Reports Are Managed
Most reports on harassment, sexual misconduct or hate incidents come through the Report and Support system, although a small number of the complaints against students are submitted directly to the Student Policy, Casework and Compliance team.
Complainants will always be treated with dignity and respect, and we are fully committed to investigating any complaints or disclosures that are made. We work together with other appropriate agencies where necessary, which could include the Police, Sheffield City Council, the University of Sheffield or other groups and support services.
Information on how reports are managed is detailed in the 'Reporting' section of our Report and Support website, where a flow chart summarises the process (Figure 1). Information is also provided for those who have been accused of something.

Figure 1: Summary of the Report and Support reporting process.
For staff reporting an incident about themselves to the service, the Report and Support team will offer them an initial support call from where they will be signposted to further help, as appropriate. For example, this may be to their line manager, Human Resources and Organisational Development or the Employee Assistance Programme (an external service offered to University staff).
Data Insights
Overview
Total Number of Reports
During 2023-24 the University had around 34,000 students enrolled and 3,500 staff employed. Chart 1 shows that the Report and Support service received a total of 418 reports in 2023-24, slightly higher than the 394 received in 2022-23. Although the number of reports has increased each year since 2018-19, the rate is slowing, with an increase of 6% in 2023-24 compared to a 15% increase in 2022-23. There were peak reporting times in October, November and February, the latter showing a marked rise compared to the previous year. Most other months had slightly fewer reports than in 2022-23.
Chart 1: The number of reports received by month for 2023-24 compared with 2022-23. (Hover over each bar and the number will appear).
Anonymous and Named Reports
As shown in Chart 2, the majority of reports we received were with personal details rather than anonymous. This continues a trend observed over the last four years where 75% of reports have been from people who included their personal details.
This is important, firstly because each reporting party can be responded to and receive support, as appropriate. In addition, the consistently high proportion of reports with personal details suggests a level of trust in our Report and Support Service, something we would hope to sustain, whilst valuing that some people may still prefer to report anonymously.
| Report anonymously | 99 (23.7%) |
|---|---|
| Report with personal details | 319 (76.3%) |
Chart 2: The number of anonymous reports compared with reports made with personal details in 2023-24.
Table 1 shows that in 2023-24, staff reporting on behalf of themselves were less likely to report with their personal details than students. However, there was a shift to more staff reporting with personal details about themselves, with the previous all-time ratio having been 50:50. By comparison, there has always been a bias towards students reporting on behalf of themselves with personal details.
Reporting on behalf of self | Anonymously | With personal details |
|---|---|---|
Student | 42 (22%) | 150 (78%) |
Staff | 8 (40%) | 12 (60%) |
Table 1: The number of reports submitted on behalf of oneself for students and for staff.
Reasons for Reporting Anonymously
The reasons for reporting anonymously are shown in Table 2. Of note is that the two highest reasons, Worried about possible repercussions and Worried the perpetrator would retaliate, suggest there was a fear of further harm if reporting with details. Equal second highest reason, Nothing would be done if I made a complaint, suggests a lack of confidence about the response. There is a need, therefore, to look at how we can further encourage people to report with their details.
Reason for Reporting Anonymously | Number |
|---|---|
I am a member of staff reporting anonymously on behalf of someone else for monitoring purposes only | 5 or fewer |
I am worried about repercussions of making this referral | 5 or fewer |
I don't think it is serious enough to warrant a complaint | 8 |
I don’t want anyone to know it took place | 14 |
I don't want the person this report is about to be aware I'm reporting | 5 or fewer |
I don't want to be contacted about this | 5 or fewer |
I don't want to get anyone into trouble | 9 |
I have no more information to give | 8 |
I reported it to someone at the University but they didn’t take it seriously | 10 |
I'm worried about possible repercussions | 27 |
I'm worried the perpetrator would retaliate | 23 |
My identity is not relevant to this report | 5 or fewer |
Nothing would be done if I made a complaint | 23 |
Other | 9 |
Table 2: The reasons for reporting anonymously. Please note that people can select more than one reason.
Who Was Reporting?
Table 3 shows the number of reports made by University staff, students or other persons, each broken down by whether they were reporting on behalf of themselves, someone else or Reporting Other. Reporting Other ensures we cover a variety of scenarios which might include, for example, someone who witnessed something by which they were not directly affected, such as racist graffiti or someone reporting an incident with multiple people involved.
Most reports were made by students on behalf of themselves (46%) compared to a much lower number of staff reports on behalf of themselves (5%). Most staff reports were on behalf of someone else (33%) and of these, 133 (97%) were reporting on behalf of a student. Staff reporting on behalf of themselves was only 20 persons (5%). In light of this, the equality monitoring data focuses on students and compares to student demographics.
Reporting Party's Relationship to the University | Reporting on Behalf of Myself | Reporting on Behalf of Someone Else | Reporting Other |
|---|---|---|---|
Staff | 20 | 137 | 5 or fewer |
Student | 192 | 23 | 5 or fewer |
Other | 22 | 15 | 5 or fewer |
Table 3: The reporting party's relationship to the University and whether they are reporting on behalf of themselves, on behalf of someone else or something different.
Equality Monitoring Data
Equality data helps us to identify areas for awareness-raising and other actions, and is optional for the reporter to provide on the Report and Support reporting form. Approximately 90% of reporting parties provided this information. The following tables relate to data about the person who experienced the incident, regardless of whether they reported for themselves or someone reported on their behalf. As indicated in Table 3, the majority of reports were either from students or on behalf of students. The equality data focus is therefore on students, with figures compared to the University demographic data based on self-reporting at the time of registration where we have it and to HESA data where we do not.
Gender
Reporters have the option of describing their gender or that of the person they are reporting on behalf of. Table 4 shows that, as in previous years, reported incidents were more likely to come from females, with 59% of reports from females compared with 23% of reports from males. Reports from females were consistent with their making up 57% of the total student population, whereas males made up 43%, so are underrepresented.
The reporting form also provides the option of saying whether the gender of the reporter or person they are reporting on behalf of matches the sex they were assigned at birth. 11 students said they had a different gender to the sex they were assigned at birth; however, we do not have a baseline of our student population to compare this to, as the University does not collect this data at registration.
Gender | Reports Submitted | % Reports Submitted | % University Students |
|---|---|---|---|
Female | 246 | 58.9 | 57.2 |
Male | 95 | 22.7 | 42.5 |
Other | 12 | 2.9 | 0.1 |
Prefer not say | 13 | 3.1 | - |
Not answered | 52 | 12.4 | 0.2 (Refused) |
Table 4: The number of reports by gender compared to University demographics.
Age
Table 5 indicates that most reports (40%) came from 18-21 year-olds. This is consistent with previous years, though since 2018-19 there has been a steady decline. 22-25 year-olds were over-reporting at almost 20% compared to the 14% of students enrolled at the University in the 22-24 year-old category.
Age | Reports Submitted | % Reports Submitted | University Age Categories | % University Students |
|---|---|---|---|---|
18-21 years | 166 | 39.7 | 18 or under - 21 years | 54.4 |
22-25 years | 82 | 19.6 | 22-24 years | 14.0 |
26-35 years | 57 | 13.6 | 25-34 years | 19.0 |
36-45 years | 26 | 6.2 | 35 years and over | 13.0 |
46 years and over | 15 | 3.6 | - | - |
Prefer not to say | 18 | 4.3 | Unknown | 0.0 |
Not answered | 54 | 12.9 | - | - |
Table 5: The number of reports by age compared to University demographics.
Sexual Orientation
Table 6 compares reporting party's sexual orientation with that of the HESA Student Return's Standard Registration population, which best represents the majority of enrolled students at Sheffield Hallam. Reports from people identifying as Bisexual were disproportionately high at 12%, over double the HESA baseline. Similarly, reports from people identifying as Gay / Lesbian and Gay man combined and as Other were also more than double the HESA comparison, suggesting there were more incidents targeting these groups.
Sexual Orientation | Reports Submitted | % Reports Submitted | % HESA Student Return |
|---|---|---|---|
Asexual | 9 | 2.0 | - |
Bisexual | 48 | 11.5 | 4.7 |
Gay man | 11 | 2.6 | - |
Gay / Lesbian | 10 | 2.4 | 2.2 |
Heterosexual | 147 | 35.2 | 70.4 |
Other | 17 | 4.1 | 1.6 |
Prefer not to say | 64 | 15.3 | 5.4 |
Not answered Not available | 112 - | 26.8 - | - 15.7 |
Table 6: The number of reports by sexual identity compared to HESA demographics.
Ethnicity
Table 7 reveals that no minority ethnic groups were reporting in higher proportions than their student population, similar to the previous year of 2022-23.
Ethnicity | Reports Submitted | % Reports Submitted | University Ethnicity Categories | % University Students |
|---|---|---|---|---|
Arab | 6 | 1.4 | Arab | 1.5 |
Asian or Asian British | 46 | 11.0 | Asian | 19.2 |
Black or Black British | 26 | 6.2 | Black | 8.6 |
Chinese | 7 | 1.7 | - | - |
Mixed White and Black Caribbean, African or Asian | 7 | 1.7 | Mixed | 3.3 |
Other | 11 | 2.6 | Other | 0.5 |
Other Asian Background | 13 | 3.1 | - | |
Other Black Background | 6 | 1.4 | - | |
Other Mixed Background | 6 | 1.4 | - | |
White | 195 | 46.7 | White | 65.1 |
Prefer not to say | 28 | 6.7 | Prefer not to say | 1.6 |
Not answered | 67 | 16.0 | Refused | 0.2 |
Table 7: The number of reports by ethnicity compared to University demographics.
Disability
Table 8 shows that 23% of reports were from people who had declared a disability, compared with a lower portion (20%) of students with a declared disability in our student population. However, this is an improvement on 2022-23, where the gap was larger, with 28% of reports to Report and Support from those declaring a disability compared with 21% in the student population.
Disability | Reports Submitted | % Reports Submitted | % University Students |
|---|---|---|---|
Yes | 97 | 23.2 | 19.5 |
No | 204 | 48.8 | 78.0 |
Unsure | 63 | 15.1 | 2.5 |
Prefer not to say | 11 | 2.6 | - |
Not answered | 43 | 10.3 | - |
Table 8: The number of reports by declaration of disability compared to University demographics.
Religion or Belief
Table 9 compares the reporting party's religion or belief with that of the HESA Student Return's Standard Registration population.
Religion | Reports Submitted | % Reports Submitted | % HESA Student Return |
|---|---|---|---|
Buddhist | 5 or fewer | 5 or fewer | 0.8 |
Christian | 51 | 12.2 | 23.7 |
Hindu | 11 | 2.6 | 3.9 |
Humanist | 5 or fewer | 5 or fewer | - |
Jewish | 5 or fewer | 5 or fewer | 0.1 |
Muslim | 24 | 5.7 | 10.4 |
Sikh | 5 or fewer | 5 or fewer | 0.6 |
Other | 14 | 3.3 | 2.1 |
Spiritual | 8 | 1.9 | - |
No religion | 134 | 32.1 | 43.6 |
Prefer not to say | 49 | 11.7 | 14.7 |
Not answered | 114 | 27.3 | - |
Table 9: The number of reports by religion or belief compared to HESA demographics.
Who Was the Reported Party?
The 'reported party' is the person that the reporter is talking about or accusing when they make a report to the University. Where a complaint is made, whether it relates to a student or staff member, or to someone outside of the University, it is important to note that the allegation is not proven at the point it is reported.
The University will not make assumptions on the relative merits of a complaint. No party will be considered ‘guilty’ until a complaint has been investigated, however, some preventative measures may be put in place if there is an indication of further risks. All those involved in a complaint will be treated fairly and offered advice and support. If there has been a crime reported, the University will comply with the requirements of the police investigation.
Chart 3 summarises the reported party's relationship to the University, with the majority being Sheffield Hallam students (41%). Given that most reports were made by or on behalf of students, it was mainly students reporting other students to Report and Support.
Reported Party's Relationship to the University
| Not answered | 15 (3.6%) |
|---|---|
| Not associated | 103 (24.6%) |
| Other | 21 (5.0%) |
| Sheffield Hallam University Staff | 33 (7.9%) |
| Sheffield Hallam University Student | 171 (40.9%) |
| Unknown | 75 (17.9%) |
Chart 3: The reported person's relationship to the University.
What Was Being Reported?
Incident Type
Chart 4 shows that the highest incident type reported, making up a quarter of all reports, was Bullying / Harassment (which included five or fewer reports of Stalking). This has been the highest category for the last four years. Although there were 18 more reports in 2023-24 than in 2022-23, it was less of an increase than in the previous reporting period, which had 40 more reports of Bullying / Harassment in 2022-23 than 2021-22. The majority (54%) indicated that the reported party was a Sheffield Hallam University student, 10% were University staff and 18% were not associated with the University.
Most proportions of incident type were similar to the previous year, although Damage to Property and Drink Spiking, both relatively small numbers, halved from 2022-23.
| Bullying / Harassment | 170 |
|---|---|
| Damage to Property | 10 |
| Domestic and Relationship Abuse | 71 |
| Drink Spiking | 11 |
| Online Abuse | 50 |
| Other | 72 |
| Physical Abuse | 47 |
| Racism | 45 |
| Sexual Assault | 96 |
| Sexual Harassment | 44 |
| Verbal Abuse | 82 |
Chart 4: The number of reports by incident type. Please note that people can select more than one incident type.
Motivating Factor
Reporters are invited to say whether they believe the incident was motivated by prejudice (hate) based on any protected characteristics, so data on the motivating factor is based upon the reporting party's perspective. Table 10 shows the suspected motivating factor of incidents, with 44% having None, meaning that over half (56%) were thought to be based on hate. Where a motivating factor was selected, the highest figures are for Gender (12%) and Race / Ethnicity (12%).
Suspected Motivating Factor | Number |
|---|---|
Age | 15 |
Disability | 21 |
Gender | 48 |
Marriage or civil partnership | 5 or fewer |
None | 185 |
Other | 39 |
Pregnancy and maternity | 5 or fewer |
Race / Ethnicity | 52 |
Religion / Belief | 24 |
Sexual Orientation | 22 |
Transgender / non binary identity | 7 |
Table 10: The suspected motivating factor. Please note that people can select more than one factor.
Where Were Incidents Taking Place?
The locations of incidents are summarised in Chart 5, with the largest number of 147 (30%) for Off campus (for example, in a bar, club, private or student house or hotel), which is slightly lower than the 33% in 2022-23. The second highest figure of 88 (18%) is for On campus, slightly lower than the previous year's 21%. At placement incidents doubled from 10 (2%) in 2022-23 to 21 (4%) in 2023-24. The number of Online incidents rose by only 1% from the previous year to 14% in 2023-24.
| As part of a Hallam University club / sports society or activity | 12 |
|---|---|
| At placement | 21 |
| At work | 11 |
| Halls of residence | 49 |
| Not known | 22 |
| Off campus | 147 |
| On campus | 88 |
| Online | 68 |
| Other | 69 |
Chart 5: The location of incidents. Please note that people can select more than one location.
University Departments
Chart 6 summarises the reporting party's University department. Considering the proportions of student enrolments at the University for 2023-24 (BTE 32%, HWLS 31% and SSA 37%), the number of reports for Health, Wellbeing and Life Sciences was disproportionately high. The lower number of reports from Professional Services is consistent with the proportion of staff reporting on behalf of themselves.
| College of Business, Technology and Engineering | 80 (19.1%) |
|---|---|
| College of Health, Wellbeing and Life Sciences | 113 (27.0%) |
| College of Social Sciences and Arts | 144 (34.4%) |
| Other | 58 (13.9%) |
| Professional Services | 23 (5.5%) |
Chart 6: The reporting party's University department.
What Happens After a Report Is Made?
The Report and Support form offers the reporter options on their desired outcome in making the report. Reporters can select more than one option and it is common to select both Discuss options / be referred to support services and Request the University takes action.
Table 11 shows the options selected by students, staff and other reporting parties. Knowing that most staff reports were on behalf of students (133 or 83%), we can see that the majority of students, around 220, wanted to discuss options and be referred to services, whether reporting on behalf of themselves or via a member of staff. A much smaller portion, around 120 students, requested that the University take action.
Reporting parties who request to Discuss options / be referred to support services, whether they are a student or staff member, are offered an appointment with a member of the Report and Support team and 180 individuals attended at least one appointment in 2023-24.
Reporting Party's Relationship to the University | Desired Outcome: Discuss Options / Be Referred to Support Services | Desired Outcome: Request the University Takes Action | For information Only |
|---|---|---|---|
Staff | 114 | 34 | 18 |
Student | 129 | 90 | 16 |
Other | 10 | 14 | 5 or fewer |
Table 11: The reporting party's relationship to the University split by their desired outcome. Please note that people can select more than one desired outcome.
Formal Reports and Outcomes
How Many Reports Translated into Formal Complaints?
Students are offered several routes for raising a concern if they feel they have been the victim of sexual misconduct, harassment, bullying or discrimination. Most are directed to Report and Support, although some complaints are received directly through the University complaints procedure without being reported on the Report and Support system.
However, the desired outcome from reporting does not always translate into a formal complaint. This could be for a number of reasons: for example, the reporting party does not respond to an offer of an appointment or follow-up; or they may decide, after discussing their options, that they do not wish to make a complaint; or on further investigation, the behaviour that they have reported does not constitute a breach of the Student Code of Conduct (which is often the case for students reporting other students where the relationship has broken down between the two parties, for example, between housemates).
Table 12 shows that the number of reports to Report and Support that progressed to a formal complaint in 2023-24 was relatively small. The 306 reports of harassment, bullying and discrimination to Report and Support comprised 169 for Bullying / Harassment, 45 for Racism and 92 for the other incident types (excluding Sexual Harassment and Sexual Assault) where a discriminatory motivating factor was selected.
Sexual Misconduct Complaints | Harassment, Bullying and Discrimination Complaints | |
|---|---|---|
Reports to Report and Support | 140 | 306 |
Report and Support reports that translated into formal complaints against students | 7 | 27 |
Formal complaints against students made directly via University complaints procedure | 5 or fewer | 34 |
Formal complaints against staff | 5 or fewer | 11 |
Table 12: The number of reports that progressed to a formal complaint.
Disciplinary Outcomes for Students
Any formal complaints against students are investigated by our Student Policy, Casework and Compliance team in accordance with the Student Anti-Harassment Policy and Procedure.
Table 13 summarises the student disciplinary outcomes for 2023-24. Note, ‘On hold’ cases were ongoing cases due to police investigation. Where appropriate, interim arrangements such as a 'no contact arrangement' between students may be set if police investigations are ongoing.
There was insufficient evidence to support further action on 23 of the Harassment, Bullying and Discrimination allegations. The reason for reaching this decision was one of the following: no indication of a breach of the Student Code of Conduct; not possible to confirm the reported person as a student at the University; the reported person was no longer a student at the University; or the case had already been considered via the disciplinary process.
Outcome | Sexual Misconduct Complaints | Harassment, Bullying and Discrimination Complaints |
|---|---|---|
On hold | 5 or fewer | 5 or fewer |
Allegation withdrawn/not progressed by reporter | 5 or fewer | 9 |
Allegation investigated but insufficient evidence to support further action | 5 or fewer | 23 |
Allegation considered at the internal resolution stage and a no contact agreement put in place | 5 or fewer | 9 |
Allegation considered at the internal resolution stage and advisory notices issued to students | 5 or fewer | 8 |
Allegation considered at Formal Stage 1 and sanction applied | 5 or fewer | 5 or fewer |
Allegation considered at Formal Stage 2 and sanction applied | 5 or fewer | 5 or fewer |
Referred to other processes (e.g. complaints process) | 5 or fewer | 8 |
Total | 12 | 61 |
Table 13: Summary of student disciplinary outcomes.
Disciplinary Outcomes for Staff
Any complaints of sexual misconduct, harassment, bullying or discrimination against staff are investigated in accordance with the University's Disciplinary Procedure as part of the Problem Resolution Framework.
Table 14 summarises disciplinary outcomes for complaints of staff sexual misconduct (sexual harassment or sexual assault) and complaints of harassment, bullying or discrimination by staff.
Outcome | Sexual Misconduct Complaints | Harassment, Bullying and Discrimination Complaints |
|---|---|---|
Issue/complaint upheld and sanction applied | 5 or fewer | 5 or fewer |
Issue/complaint not upheld and no sanction applied | 5 or fewer | 5 or fewer |
Issue/complaint withdrawn by reporter | 5 or fewer | 5 or fewer |
Issue/complaint resolved informally | 5 or fewer | 5 or fewer |
Total | 5 or fewer | 11 |
Table 14: Summary of staff disciplinary outcomes.
Training for Students and Staff
Training for Students
To promote an inclusive campus community the Epigeum Being an Active Bystander module was introduced in 2021. All students are asked to complete the module and receive a link to this on their course induction schedule. The course teaches our students how to recognise harassment and hate incidents, appropriate strategies for intervening and how to make a positive impact on our University community from the start.
In 2023-24, 1,381 students registered for Being an Active Bystander. Of those, 795 students passed the course (compared to 203 the previous year); 8 finished the course but failed the test; 114 started the course but didn’t finish it; 464 registered but did not start the course. Of the number of students who registered for the module, 58% passed the course. Our student intake was 5,544, so 14% of the overall eligible student population completed the course successfully. Although the number of students passing the module almost quadrupled compared to the previous year, there is still work to be done to increase engagement with the training.
Training for Staff
The University launched the Protect and Respect staff learning and development programme in 2021, aimed at all staff, regardless of role. The programme presents the University’s vision for a safe and inclusive culture and inspires staff to take an active role in promoting and maintaining this. It provides a space for engaging in conversation, exploring different perspectives and challenging biases. It encourages all staff to be active bystanders and enables them to recognise inappropriate behaviour and understand how best to challenge it.
Module 1 - Staff attend Actively Building a Safe and Inclusive Culture, a 90-minute workshop that is held live online. This was completed by 118 staff members in 2023-24.
Modules 2 and 3 - Staff are asked to complete two e-learning modules provided by Epigeum: Being an Active Bystander (completed by 134 staff members) and Responding to Disclosures (completed by 110 staff members).
The main challenge has been gaining wider engagement with the programme, which is something we aim to resolve.
Awareness Raising
Events and Campaigns
In 2023-24, awareness raising events and publicity across the University included stalls, web articles, posts on Instagram Stories and content in the Student Digest (fortnightly student newsletter) at key times of year for: Holocaust Memorial Day, Sexual Violence Awareness Week ('It’s Not OK' campaign) and Anti-Bullying Week. In addition, the University's Equity, Equality, Diversity and Inclusion staff website has a dedicated page for awareness days, which are also promoted through department bulletins and web pages.
Following reports of the escalating conflict in the Middle East in 2023, students and staff were emailed and signposted to University-wide messaging which included guidance and support. Individualised support was offered to students and staff with citizenship or familial connections to Israel, Palestine or Lebanon.
Awareness of Report and Support
Report and Support is promoted throughout the year at key times, such as the start of semester and welcome week in September and January, the end of exams in January and May, and dark nights / festive season in December.
Undergraduate (UG) home students and postgraduate (PG) overseas students who started in September 2023 were asked to complete a survey about Hallam Welcome (welcome week) in the following October and November. 752 out of 5,669 UG students responded to the question about Report and Support: 76% were aware of the service and, of those, 10% had used it. 13% said the service may be useful but they did not know where to find it. 186 out of 1,073 PG students responded to the question about Report and Support: 83% were aware of it and, of those, 54% had used it. 12% said the service may be useful but they did not know where to find it.
Visits to the Report and Support website increased for nearly all the top twelve-viewed pages in 2023-24 compared to the previous year, with most visits (505) to the Get help and information page, which more than doubled. The next most popular pages were What happens when I make a report? (433 views), What are Bullying and Harassment? (258 views) and I have been accused of something (173 views). The only page with less views than the previous year was What is racism? which had 112 views compared to 117 the year before.
Being an Active Bystander Module
To communicate our stance on what is and what is not tolerated, the Being an Active Bystander module for students is promoted in pre-arrival email communications and on social media during the first weeks of Hallam Welcome, our welcome programme for new and returning students, and is included on our Explore webpage. There is also a dedicated section about Report and Support in the Insider’s Guide directory for new students.
In addition, Being an Active Bystander sessions were delivered by the Student Experience, Teaching and Learning team to a particular cohort of students following reports of bullying.
Equality, Diversity and Inclusion Mini-modules
During 2023-24, the Hallam Mini-modules, a suite of short online modules designed to aid students’ personal and professional development, were piloted with over 8,800 students. These included a suite of EDI (Equality, Diversity and Inclusion) Mini-modules covering: Importance of Equality, Diversity and Inclusion (Intro Module); Microaggressions; Becoming Anti Racist; Language and Identity; and Embracing Diversity. Students were asked to complete the introductory Importance of Equality, Diversity and Inclusion module initially and after that, they could choose which modules to do and in what order.
Trauma-informed Support Sessions
In order to improve the experience of all parties involved (reporting and reported), the Report and Support team developed awareness sessions on a Trauma-informed Approach and Principles (see Figure 2). This is available for staff teams who may be involved in supporting students or staff, or handling cases relating to harassment, sexual misconduct and hate. We hope this will increase trust and confidence, and remove barriers to reporting by embedding trauma-informed principles throughout the process of disclosing, reporting and investigating. In 2023-24, the training was delivered on a small-scale to several teams, with the aim of broadening the audience the following year.
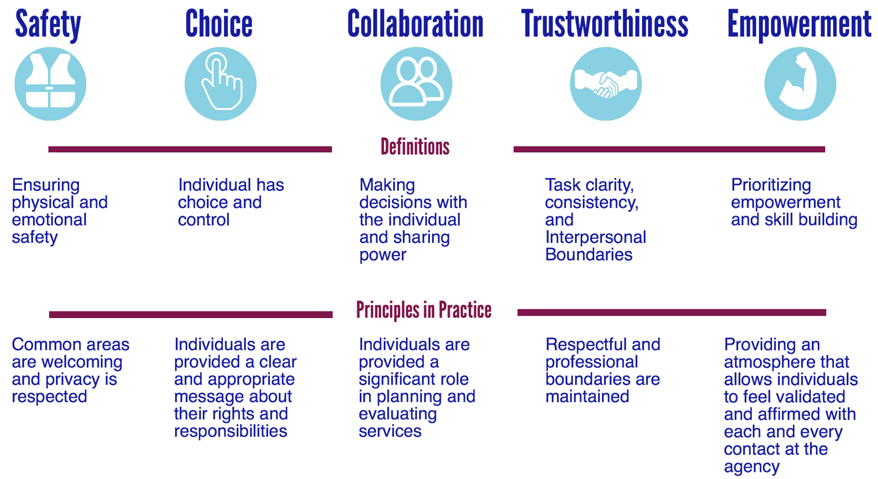
Figure 2: Summary of trauma-informed principles, reproduced from Sebton (2021).
Targeted Awareness Raising
The Student Policy, Casework and Compliance team continued to work closely with Sport Hallam to ensure that behavioural expectations were addressed during sports club member induction sessions, coach inductions and briefings for sports club committee members. No conduct issues were reported in 2023-24 regarding the behaviour of students attending Varsity events.
Feedback and Evaluation
Providing feedback is never mandatory but is always appreciated and helps us improve our service. The Student Wellbeing service (which includes the Report and Support team) asks all the students it supports to complete an optional feedback form, sent towards the end of each semester.
In 2023-24, 22 people responded to the Report and Support section of the feedback survey and 86% of those agreed or strongly agreed that the overall offer of support they received from the Report and Support team was helpful.
The feedback highlights appreciation from service users for practical support, such as being provided with information and ‘actionable advice’, being presented with options to make informed choices, being referred to appropriate support, having check-in calls between appointments where needed and flexible timings of appointments.
There was also positive feedback on the emotional support provided, such as help to manage the impact of incidents, support to process difficult emotions, receiving support and empathy, and having a calm, non-judgemental response; respondents said they felt cared for, were listened to, felt less isolated, were in a safe space, were taken seriously and reassured.
When asked what advice they would give to other students in the same situation as they were, answers included:
- Talk, tell someone - "even if you don’t want it to go further", “never feel your problems aren’t big enough”
- Don’t isolate yourself - "seek out help when you are ready"
- Get information about next steps
- Compile evidence
- Don’t be afraid of speaking about what happened - "speak up even when it’s hard, you will be heard"
- "Use the facilities provided by the University"
When asked for any suggestions to improve the service, emerging themes were around having more appointment availability and introducing drop-ins and online chat; more awareness-raising, such as sessions on anti-bullying in lectures; sharing experiences by having group work and adding other students' experiences to our website or activities; more pathways and support for staff members.
Updates and Next Steps
Improvements in 2023-24
Made It Easier for People to Report
We routinely reviewed the Report and Support reporting form to make it as simple as possible to complete. This included ensuring that the questions were relevant, not asking for unnecessary information and checking that we were asking the right questions. For example, we included stalking as a separate incident type; we also reduced information requested on the reported party.
Encouraged Reporting with Details
We attempted to address the top reasons people report anonymously (Worried about possible repercussions, Worried the perpetrator would retaliate, Nothing would be done if I made a complaint) by amending the wording on the Report and Support website and reporting form to emphasise the confidentiality of the service. We have explained that no action will be taken until the Report and Support team has spoken to the reporting party and that, normally, no action will be taken without their agreement. The exception might be where there is a duty of care or safeguarding need, for example, where the reported party is teaching students.
Enhanced Our Ability to Monitor and Respond to Risk
In line with practices in the wider Student Wellbeing service, we invited reporters who were reporting on behalf of themselves and with their details to tell us if they were at risk of harm to themselves or harm from others. This has enabled us to be more proactive about ensuring they are accessing support services.
Established a Survivors' Group
We developed a six-week programme for survivors of sexual abuse, including psychoeducational group sessions and peer support opportunities. We promoted this initially to existing Report and Support clients, then extended it for all students to express an interest. Unfortunately, the numbers expressing interest did not translate into attendance and reduced so that we did not have a 'group'. We have, therefore, offered the psychoeducational sessions on a one-to-one basis. We will keep reviewing how we might provide a safe space for peer support and education.
Introduced Trauma-informed Yoga Sessions
We started a therapeutic trauma-informed yoga group for students, among them survivors of sexual violence. This was a six-week course with a small group of six to eight people by referral only through Student Wellbeing practitioners. After the six-week course students were invited to join the standard weekly Yoga for Wellbeing class run by the Student Wellbeing service.
Areas for Development in 2024-25
Many of the activities outlined in this report are part of Sheffield Hallam’s ongoing commitment to be a safe, tolerant and inclusive community. Policies, services such as Report and Support, training and awareness raising have been embedded as standard practice, supported by an effectual University governance structure.
The University’s Harassment Sexual Misconduct and Hate Crime Steering Group will continue to provide oversight of this work, focussing on enhancing what we already do, in order to meet the Office for Students Condition of Registration: E6 Harassment and Sexual Misconduct, which will come into force 1 August 2025. This will include reviewing our anti-harassment policies and training for staff and students, and developing a strategy for evaluation to ensure continuous improvement.
Let Us Know What You Think
Sheffield Hallam University aims to create an environment that is free from harassment, violence, hate and discrimination. If you have any feedback on this annual report or our Report and Support service, please email reportandsupport@shu.ac.uk
Reference
Sebton, S. (2021.) Why we should all be trauma-informed. University Health https://www.universityhealth.com/